Guide to Flu Shots Analysis Using PostgreSQL and Tableau

Introduction
Imagine a scenario; you are a health data analyst for a hospital in the year 2023, and the Head Doctor would like to know the total number of patients who have been getting their flu shots over the last year, as well as those who have not yet gotten a flu shot. How are you going to get this info? Well, this guide is a walk-through on how to perform a flu shot analysis using SQL to query patient data, calculate compliance rates, and visualize the results using Tableau.
The purpose is to give the healthcare team insights into flu shot immunizations in the past year based on demographics such as race, age, and geographic location.
N/B: Simulated Data was used and no privacy was breached throughout the course of this project.
Also, you can view the interactive dashboard on Tableau.
Objective of Analysis
The primary objective is to analyze flu shot compliance for 2022 by:
Gathering patient demographics (alive and active patients, age, race, geographic location) and flu shot information.
Segmenting compliance by race, age, and geographic location.
Generating lists of patients with or without flu shots.
Identifying potential areas for healthcare interventions.
Step-by-Step SQL Query Guide
We’ll use SQL queries to extract and analyze the data from a simulated healthcare system’s database. Here’s how to achieve each part of the analysis.
Step 1: Identify Active Patients
The first step is to retrieve the list of active patients within the healthcare system. An active patient is one who has had a recent encounter with the healthcare system and is still alive. To do this, create a Common Table Expression (CTE) to filter out deceased patients and include only those eligible for a flu shot (over six months old).
SQL Query:
WITH active_patients AS (
  SELECT DISTINCT patient
  FROM encounters AS e
  JOIN patients AS pat
    ON e.patient = pat.id
  WHERE start BETWEEN '2020-01-01 00:00' AND '2022-12-31 23:59'
    AND pat.deathdate IS NULL
    AND (EXTRACT(YEAR FROM age('2022-12-31', pat.birthdate)) * 12 + EXTRACT(MONTH FROM age('2022-12-31', pat.birthdate))) >= 6
)
This query identifies active patients who:
Have no recorded death date.
They are at least six months old.
Had an encounter between January 2020 and December 2022.
Step 2: Retrieve Flu Shots Data
Next, get flu shot data for the year 2022. use another CTE to find the earliest date in 2022 when a flu shot was administered to each patient. For this project, the flu code is 5302.
SQL Query:
, flu_shot_2022 AS (
  SELECT patient, MIN(date) AS earliest_flu_shot_2022
  FROM immunizations
  WHERE code = '5302'
    AND date BETWEEN '2022-01-01 00:00' AND '2022-12-31 23:59'
  GROUP BY patient
)
This query identifies flu shots administered in 2022, ensuring only the earliest flu shot date per patient is captured.
Step 3: Merge Patient Data with Flu Shot Information
Now, combine the patient demographics from the first step with the flu shot data from the second step. Use a LEFT JOIN so that all active patients are included, even if they did not receive a flu shot.
SQL Query:
SELECT pat.birthdate
      ,pat.race
   ,pat.county
   ,pat.id
   ,pat.first
   ,pat.last
   ,pat.gender
    ,EXTRACT(YEAR FROM age('2022-12-31', pat.birthdate)) AS age
      ,flu.earliest_flu_shot_2022
      ,flu.patient
      ,CASE WHEN flu.patient IS NOT NULL THEN 1
            ELSE 0
       END AS flu_shot_2022
FROM patients AS pat
LEFT JOIN flu_shot_2022 AS flu
  ON pat.id = flu.patient
WHERE pat.id IN (SELECT patient FROM active_patients)
This query generates a list of active patients, their demographics, and whether they received a flu shot in 2022.
Visualization with Tableau: How It Was Done
Using the SQL query results, Tableau was utilized to create visualizations that highlight flu shot compliance across various demographic groups. Here’s an overview of the process:
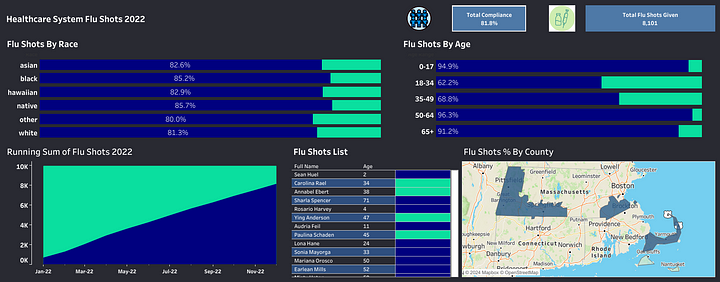
1. Flu Shots by Race

A bar chart was created showing the number of patients per race, with an overlay indicating the percentage of patients who received flu shots. A dual-axis was used to ensure that the total number of patients and flu shot percentages were clearly represented.
2. Flu Shots by Age

This visualization provides insights into compliance rates by age, indicating where additional vaccination outreach may be needed, especially in younger age groups with lower rates.
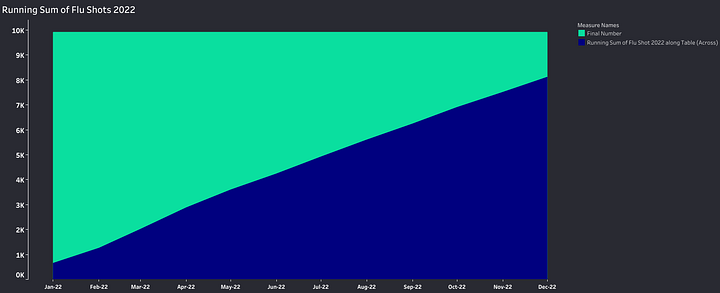
3. Running Sum of Flu Shots in 2022

This area chart is key for tracking the progress of flu shots administered over time. Healthcare administrators can use it to monitor seasonal trends and determine when flu shots were most widely administered.
The Dual-Axis technique is used to enhance the analysis by offering a more layered, nuanced view of the data.
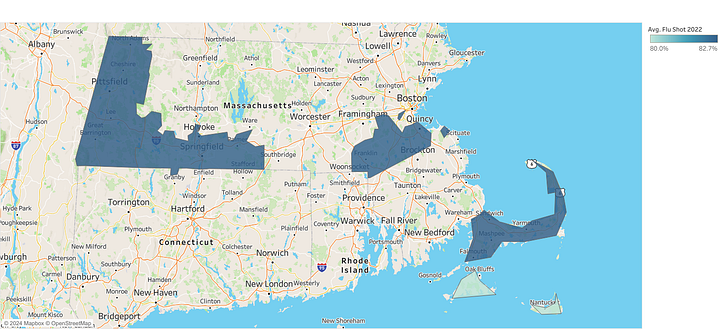
4. Flu Shots by County

Flu Shots by County
A choropleth visualized flu shot compliance by county, identifying regions where vaccination efforts may need to be intensified.
This geographic visualization helps healthcare administrators target specific regions such as Connecticut, Massachusetts, and Rhode Island — to name a few that may have lower compliance rates. This information can be used as an opportunity to strategize more localized vaccination efforts.
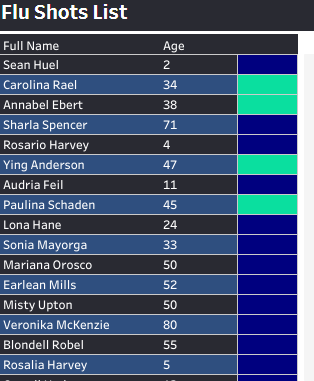
5. Flu Shots List

Flu shot List
A simple text table displayed individual patient names, ages, and flu shot status by colour code; ‘sea green’ for Non-compliance and ‘navy blue’ for Compliance.
This table provides a detailed view of individual patient compliance, offering useful information for internal record-keeping and patient follow-up.
Insights from the Analysis
- Age Disparities in Flu Shot Compliance:
The flu shot compliance by age group highlights that younger individuals (ages 18–34 and 35–49) have lower compliance rates compared to older adults and children. This is a critical insight because younger adults often neglect flu vaccinations, even though they can still spread the virus to more vulnerable populations.
2. Racial Disparities:
The compliance rate across different racial groups shows some disparity, with Black and Native populations showing higher compliance than Asian and White populations. Although the overall compliance is relatively high, targeted outreach may still be necessary to address the gaps in certain communities.
3. Geographic Disparities:
The map visualization reveals that some counties have significantly lower flu shot compliance than others. This could indicate geographic barriers to healthcare access, such as a lack of vaccination clinics or flu shot availability. Healthcare providers should focus their resources on improving access and awareness in these areas.
4. Seasonal Trends:
The running total of flu shots over time shows a consistent increase in flu shots given throughout the year, peaking in the fall and winter months. This trend aligns with typical flu season patterns, but it also emphasizes the importance of early vaccination efforts to prepare for peak flu season.
Recommendations for Healthcare Team
Target Younger Age Groups: The lower flu shot compliance rates among younger adults (18–49) suggest that this demographic requires more targeted outreach. Consider implementing educational campaigns focused on the importance of flu shots for young adults, especially in preventing the spread of flu to more vulnerable populations.
Localized Campaigns in Low-Compliance Counties: The geographic disparities in flu shot compliance indicate that certain counties are falling behind. Healthcare administrators should allocate more resources to these regions, possibly by setting up mobile vaccination clinics or increasing the availability of flu shots in underserved areas.
Address Racial Disparities: While some racial groups, such as the Black and Native populations, have higher compliance rates, others like the White and Asian populations show lower rates. Healthcare administrators should work to understand the barriers preventing these populations from getting flu shots and implement culturally sensitive outreach programs.
Focus on Early Vaccination: The seasonal trends in flu shots suggest that most people wait until fall to get vaccinated. Healthcare administrators should start flu shot campaigns earlier in the year to ensure more people are vaccinated before the flu season peaks. This can be done through workplace flu shot clinics, school programs, or offering early flu shots during routine checkups.
Leverage Data for Continuous Improvement: The insights from this dashboard should be revisited regularly. As flu shot campaigns are implemented, real-time data updates in Tableau can help healthcare administrators track improvements, identify ongoing issues, and adjust strategies dynamically.
Final Thoughts
Though the data used for this project is simulated data, the outcomes, insights, and recommendations are very applicable in a real-life scenario.
By acting on the insights provided by this analysis, healthcare administrators can improve flu vaccination rates, reduce the spread of the virus, and ensure the health and safety of their communities.
This comprehensive analysis, powered by SQL and Tableau, underscores the importance of data-driven decision-making in healthcare. With actionable insights and a clear strategy for improving flu shot compliance, healthcare systems can be better equipped to handle flu seasons and promote public health at a large scale.